The recent OPHA (Ontario Public Health Association) letter suggests municipalities,
- Strengthen local surveillance,
- Monitor and report alcohol consumption and harms,
- Build local awareness of alcohol harms to support policy solutions.
Let us dive into the evidence.
Who got admitted to the hospital?
The website says that in 2021, nearly 1,500 hospital stays (admissions) were recorded among residents of Simcoe Muskoka aged ten and above entirely due to the harmful use of alcohol. (That means these counts did not include the admissions attributable to alcohol).
The following data relate to five years from 2017 to 2021.
By age
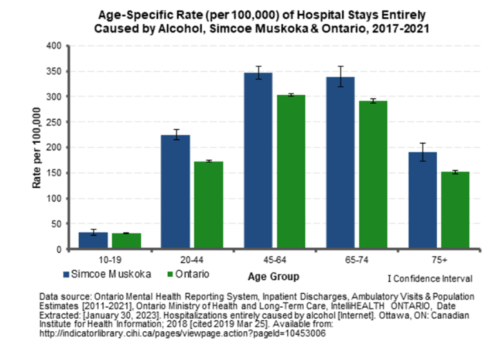
Figure 1:
Age-specific rates (per 100,000) of hospital stay entirely caused by alcohol, 2017 – 2021.
When combining all hospital stays in five years from 2017 to 2021, the majority of hospital stays came from those aged between 45 and 74. That is not surprising when we consider the median age of the residents.
However, we can find a significant difference in the median age between the District of Muskoka and Simcoe County: 52.8 versus 41.8 years! It is worthwhile to explore how it impacts hospital admissions.
By sex
We can observe striking differences here.
- The hospital admission rates are 1.7 times higher among males aged 45 and 74 when compared to those aged 20 – 44 (500 per 100,000 versus 300 per 100,000).
Why?
- In contrast, we cannot observe a similar difference among women.
Why?
- Hospital admissions are the lowest among those aged between 10-19.

Figure 2:
Age-specific rates (per 100,000) of Hospital Stays by sex.
By material deprivation
Here again, we can find compelling evidence for the socioeconomic determinants of the harmful use of alcohol:
The most deprived report the most admissions.
not only that but there is also a striking gradient along a deprivation continuum!
Moreover, the gap between the most and the least deprived is more than twice.
Where do the most deprived live?
What do they do?
Why is this gradient?
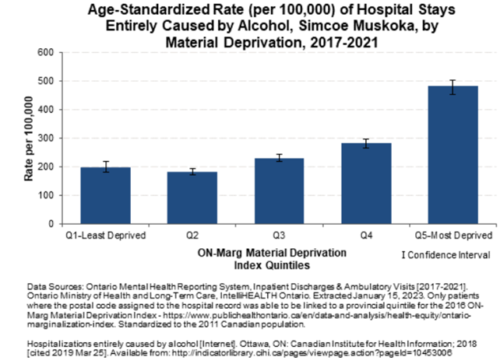
Figure 3:
Age-standardized rates (per 100,000) of hospital stays by material deprivation.
Harm paradox:
Now, compare the Figure 3 with Figures 4 (income level) and 5 (education level).
We can observe an opposite gradient here:
The higher the income level or education level higher the percentage of those who drink.
How does this happen?
This classic phenomenon is called “harm paradox”.
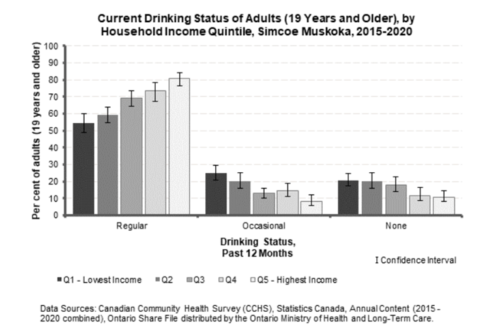
Figure 4:
Current drinking by household income
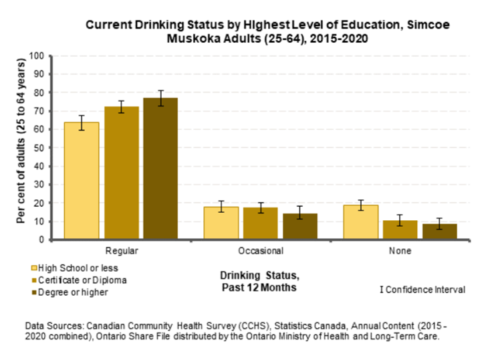
Current drinking by the level of education

