Almost two-thirds of Ontarians consume alcohol; some seek help from emergency rooms; who are they and why?
Daniel T Myran et al. (2019) investigated who and why Ontarians sought emergency rooms’ help for alcohol-related problems. Their study covered emergency room data from 2003 to 2016.
Who were they?
Two-thirds were men.
Of all ER attendees, two-thirds (67.7 per cent) were men (Figure 1).
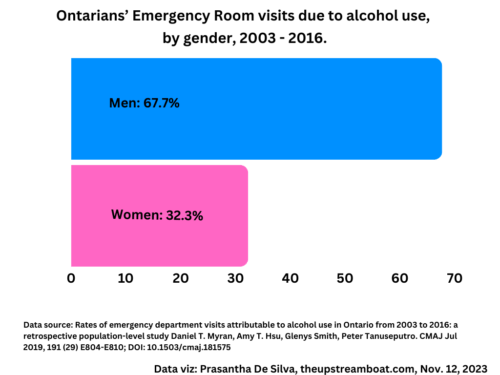
Figure 1: Ontarians’ ED visits by gender, 2003-2016
Almost half of the men were middle-aged.
Of them (men), nearly half (42.1 per cent) were between 41 and 64 years. However, almost one-tenth (9.1 per cent) were 18 or below. This is significant because the legal drinking age in Ontario is 19. Then, the number of ER attendees rose exponentially with age until it peaked at 45-64 (Figure 2).

Figure 2: Age distribution of Ontario men who visited ER, 2003-2016
Women also followed a similar pattern.
Although women also followed the same pattern, there is a notable difference: The share of girls and younger women aged 24 and below was much higher than the boys and younger men of the same age group (Figure 3).

Figure 3: Age distribution of Ontario women who visited ER, 2003-2016
The contrast is clearer in Figure 4.
More girls sought ER help than boys.
More girls and younger women, 10 – 24, than boys in the same age group sought ER help for alcohol-attributable problems. Even by absolute numbers, the pattern is the same among the youngest group; the girls aged 10-18 (below the legal drinking age) outnumbered the boys (29,646 versus 28,315) according to the published paper (Table 1).

Figure 4: Comparison of ER visits by gender and age group, 2003-2016
Gender comparison by age group
10-18 years:
As shown in Figure 4, the following Figure 5 also reveals that more girls, 10-18, than boys sought ER help for the harmful use of alcohol.

Figure 5: Comparison of ER visits of boys and girls, 10-18, due to alcohol use, 2003-2016
19-40 years
In these two age groups, 19-40, unlike the younger group, males dominate ER visits for the harmful use of alcohol. The male-to-female ratio increases markedly with age from 1.4:1 in 19-40 to 1.9:1 in 25-40 (Figure 6).

Figure 6: ER visits of men and women aged 19-24 and 25-40 due to alcohol use,2003-2016
41- 64 years
Again, in this age group, men dominate ER visits. The only difference is the male”female ratio rose to 2.3:1 (Figure 7).

Figure 7: ER visits of men and women aged 41 – 64 due to alcohol use,2003-2016
How many visits?
An overwhelming majority of both men and women had only one visit to the ER. Only one-fifth had more than one visit.

Figure 8: Number of visits by gender due to alcohol use,2003-2016
Ontarians’ emergency room visits by their income level and gender
We can observe a clear gradient between the income level and ER visits attributable to alcohol among both men and women in the following graph: Lower income higher percentage of men and women emergency room visits. This is in contrast to the binge drinking associated with income: The higher the income, the higher the binge drinking.
This is a classic demonstration of the “alcohol harm paradox” (Figure 9).
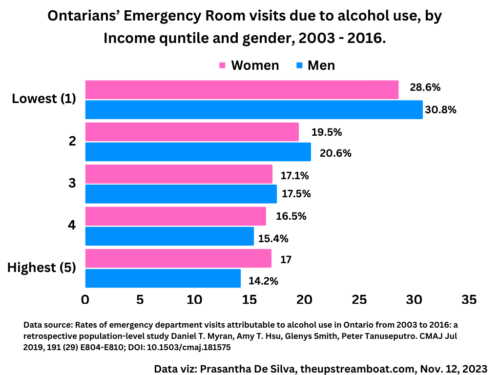
Figure 9: ER visits by gender and their income level due to alcohol use,2003-2016
Where did the majority come from? Urban-rural breakdown
As evident in the following graph (Figure 10), almost two-thirds of men and women visited large urban centres. These large urban population centres’s estimated population was equal to or more than 100,000.
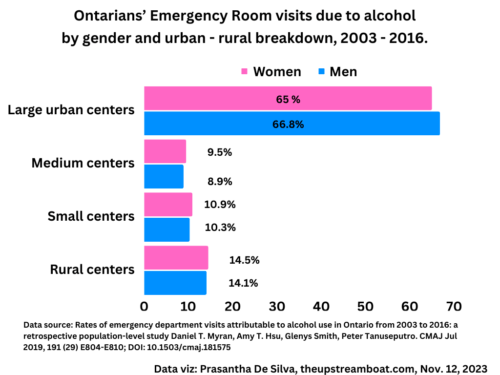
Figure 10: ER visits due to alcohol use by gender and geographic location, 2003-2016
Why did they visit emergency rooms?
As shown in Figure 11, the leading cause was intoxication; almost half of all ER visits. There was not much difference by gender.
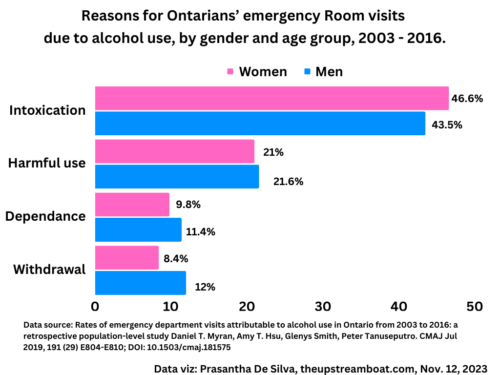
Figure 11: Four leading causes for ER visits due to alcohol use by gender, 2003-2016
Has emergency room visits increased from 2003 to 2016?
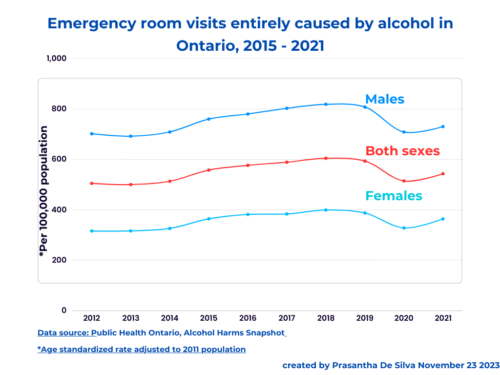
The study authors found that emergency room visit age-standardised rates per 10,000 population for alcohol-attributable causes rose disproportionately when compared to all-cause visits between 2003 to 2006.
While men’s age-standardised all-cause visits increased by 8.6 per cent from 3506.1 in 2003 to 3806.9 in 2016, the alcohol-attributable visits increased by 53.2 per cent from 51.1 per 10,000 in 2003 to 78.3 per 10,000 population in 2016.
While women’s age-standardised all-cause visits increased by 19.8 per cent from 3599.73 in 2003 to 4312.5 in 2016, alcohol-attributable visits increased by 86.5 per cent from 20.71 per 10,000 in 2003 to 38.62 per 10,000 in 2016.
The women’s ER visits increase was higher than men’s: 85.5 per cent versus 52.3 per cent.
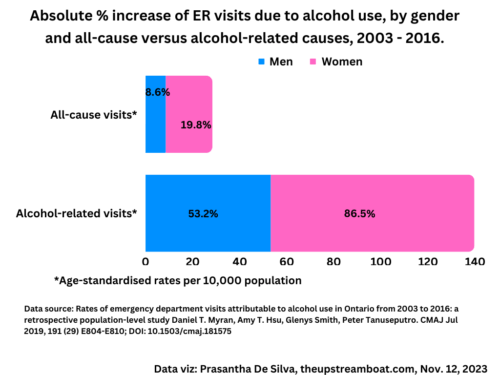
Figure 12: Comparison of % increase of all-cause and alcohol-attributable ER visits by gender, 2003-2016
Were alcohol product prices and availability determinants for the increase?
This is a critical question that authors have attempted to find some clues from this study. They believe that the price and availability are unlikely factors that may have caused to increase in visits to the ER for reasons attributable to alcohol. They argue that prices (indexed to inflation) and availability were stable until the final year of the study.
If that is the case, then, what could the factors other than price and availability?
The authors point to alcohol marketing and promotion. They cite several reports and commentaries that warn about large increases in marketing drives directed at women.
This study covered only between the 2003 and 2016 period. Significant de-regulatory changes occurred since then including the increase in availability at local stores and will occur such as drinking in parks.