It is obvious. The prevalence of diabetes and high blood pressure varies by neighbourhood in Toronto. The following maps from Ontario Community Health Profile Partnership (OCHPP) website display this geographical disparity.
The maps use a colour scale; the darker the area higher the rate. We can find a clear geographical gradient. It ranges from 4.4 per 100 (the lightest colour) to 19 per 100 individuals (the darkest colour) with regard to diabetes (Map 1). But the rates vary from 16 per 100 (the lightest colour) to 31.6 per 100 for high blood pressure (the darkest colour) (Map 2).

Map 1: Image source: Ontario Health Profiles
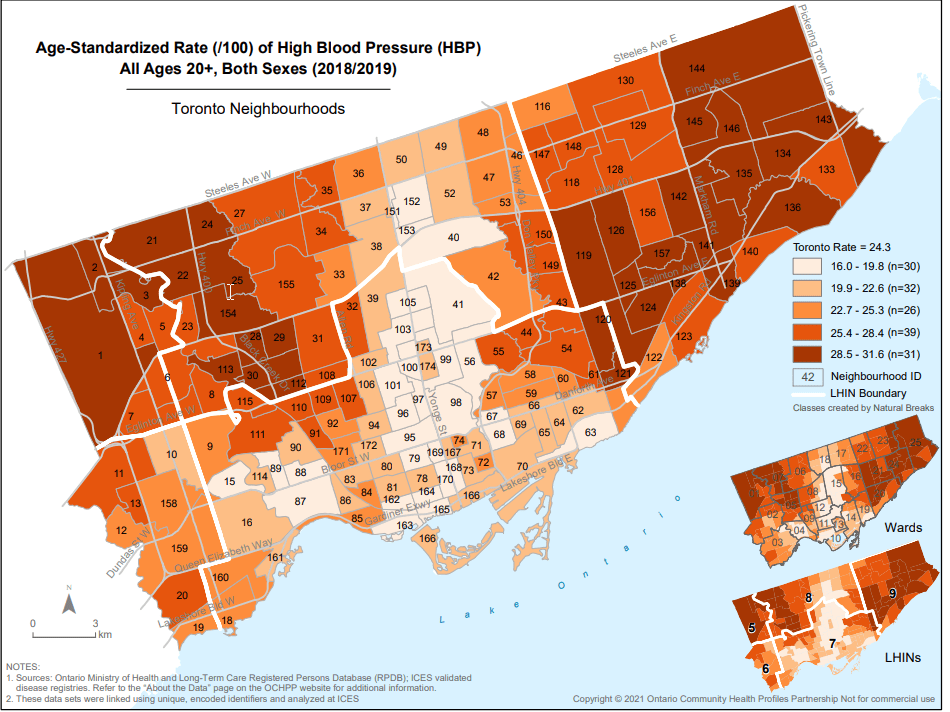
Map 2: Image source: Ontario Health Profiles
Let us explore this further.
In the above maps, the darkest brown areas correspond to the East end and the West end. It is remarkable that the colour gradient in both maps overlaps perfectly.
What does that mean?
Both the highest rates of diabetes and high blood pressure prevalence exist in the same neighbourhoods.
The geographical disparity of the ischemic heart disease
A previous study from the Toronto Public Health reveals a somewhat similar geospatial disparity for ischemic heart disease as well (Map 3). The following map shows that the highest hospitalization rates for ischemic heart disease were from the West end neighbourhoods. Again, the admission rates are three times higher than the lowest rates.
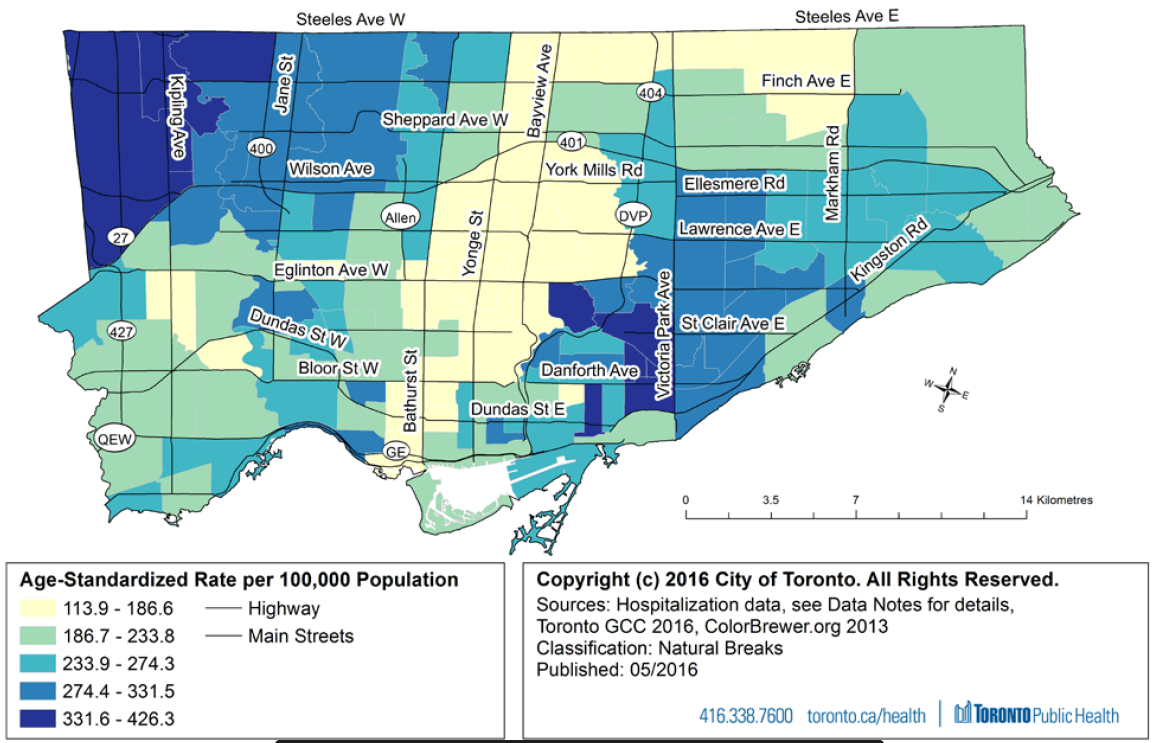
Map 3: Image source: Health Surveillance Indicators, Toronto Public Health
What exactly those neighbourhoods are?
The following table shows the neighbourhoods with its number that carry the highest diabetes prevalence rates (The areas with the darkest brown in colour). The first three rows show the West end neighbourhoods and the rest are from the East end.
The highest category ranges from 14.3 per 100 individuals to 19 per 100 individuals. The lowest category range from 4.4 to 6.5. As we can see that the rates are more than three times higher than the lowest rates.
| 1: West Humber – Clairville | 2: Mount Olive-Silverstone – Jamestown |
| 21: Humber Summit | 22: Humbermede |
| 24: Black Creek | 25: Glenfield-Jane Heights |
| 55: Thorncliffe Park | 121: Oakridge |
| 124: Kennedy Park | 125: Ionview |
| 126: Dorsel Park | 134: Highland Creek |
| 135: Morningside | 136: West Hill |
| 138: Eglington East | 139: Scarborough Village |
| 141: Golfdale-Cedebrae-Woburn | 142: Woburn North |
| 144: Morningside Heights | 145: Malvern West |
| 146: Malvern East | 157: Bendale South |
Who are living in those neighbourhoods?
As shown in Map 4, visible minority groups live in those East end and West end neighbourhoods with the highest rates of diabetes, high blood pressure and hospital admission rates for ischemic heart disease.
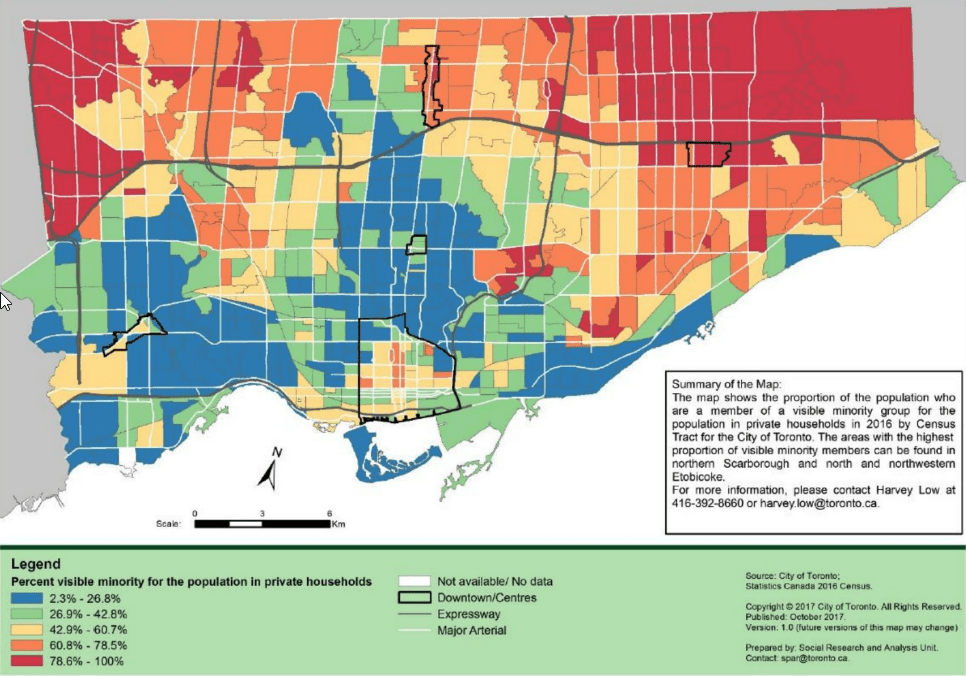
Map 4: Image source: More Neighbours Toronto
How about the income level in those neighbourhoods?
According to Map 5, the lower income percentage ranges are not higher than the Toronto average (8.7%). That means there are neighbourhoods with much higher rates of lower income levels but do not have higher rates of diabetes, high blood pressure, and hospitalization rates for ischemic heart disease.
However, in contrast, Toronto Public Health has reported previously that the lowest-income groups have the highest diabetes prevalence and incidence rates. We do not know that although the east end and west end neighbourhoods have lower percentages of lower income groups, they are the ones who live with higher rates of diabetes, high blood pressure, and ischemic heart disease.
This is an interesting finding worth more exploration.
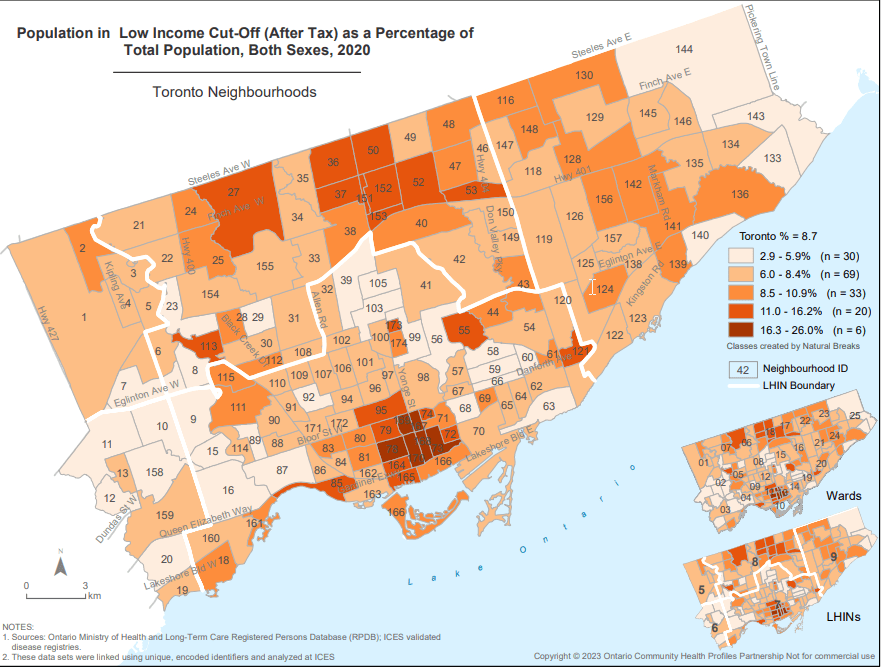
Map 5: Ontario Health Profiles
Are they marginalised?
Map 6 reveals that both West and East end neighbourhoods fall into the highest categories of marginalization: Categories 4 and 5.
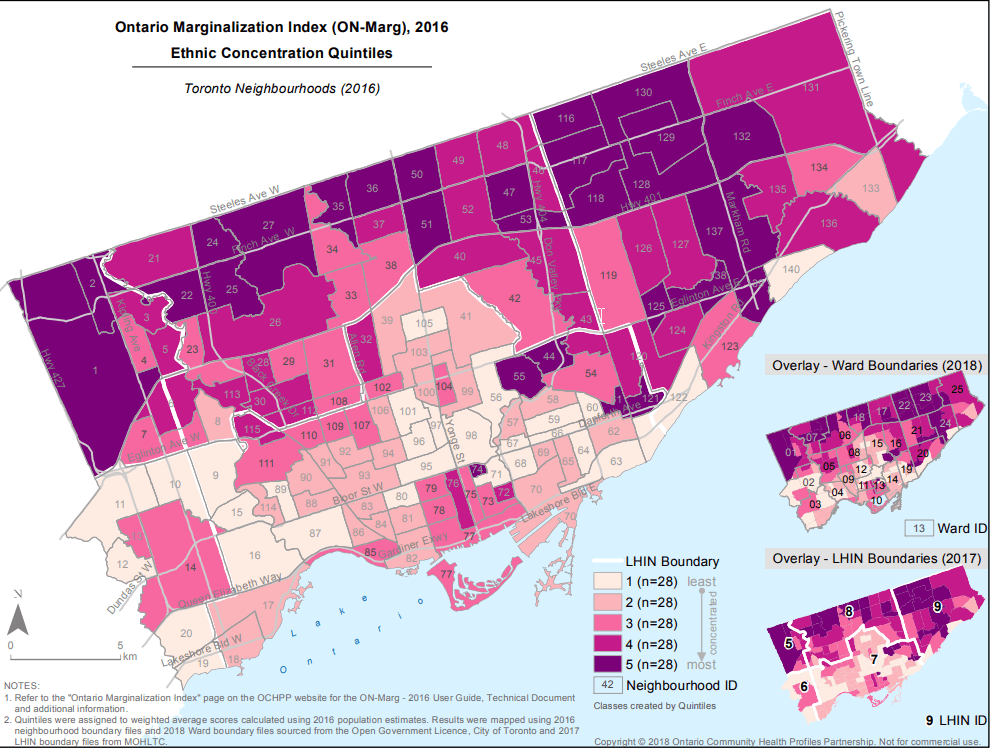
Map 6: Ontario Health Profiles
We can explore it further with other socio-economic and demographic variables.
However, now, I will delve into the disease-specific variables.
So, the place matters.
Diabetes, high blood pressure, and ischemic heart disease are public health challenges
Let us consider diabetes as an example.
Diabetes is a disease that affects almost all body systems. It leads to kidney failure, ischemic heart disease, and blindness; some may face either toe or leg amputations. It does not end there. They may develop anxiety and depression as well. They may lose productivity which affects their career advances. As a result, it affects the family economy and ultimately the country’s economy.