Updated on September 20, 2024
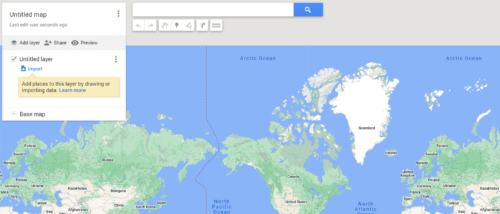
I created the following asset map using the Google My Maps tool, which is free.
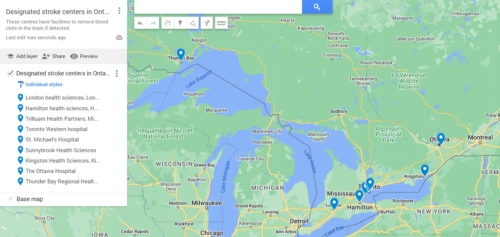
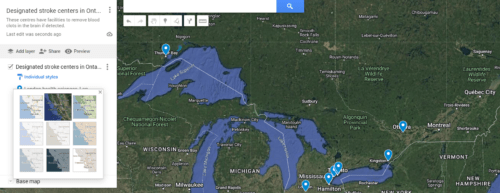
My project was to create a map of the designated stroke centres in Ontario. These centres can remove a brain blood clot that results in a stroke. Strokes are medical emergencies. If a patient suspected of a stroke reaches those centres in time, surgeons can prevent/minimise permanent brain damage.
Here are the steps I followed.
Step 1: Data collection
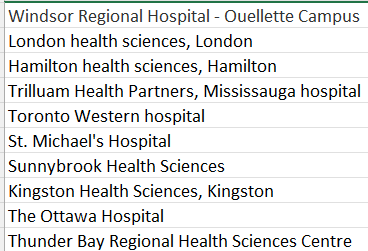
I created an Excel sheet of the designated stroke centres. I obtained the hospital names from this publicly available source: Cor Health (2018). It appears below.
Step 2: Creating the Google map.
- I logged into the Google My Map site using my account. Here is the link: https://www.google.ca/maps/about/mymaps/.
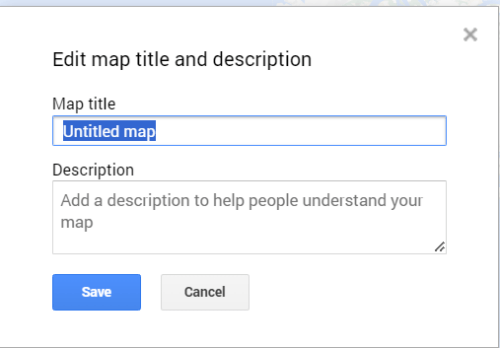
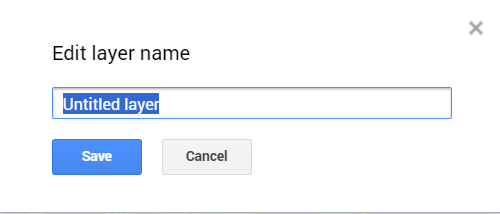
- I found the following untitled map window and named it with my project title.
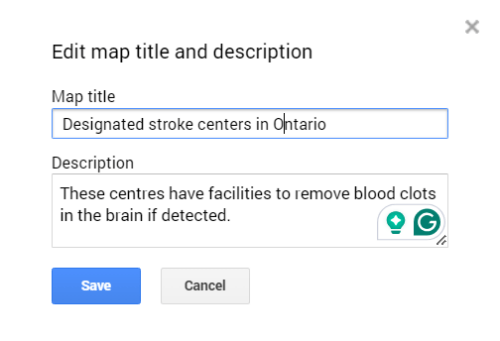
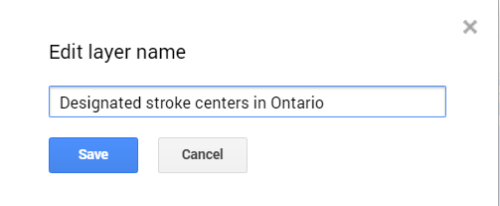
Then, I named my tool, added a description, and saved it.
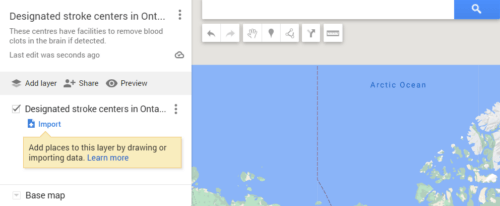
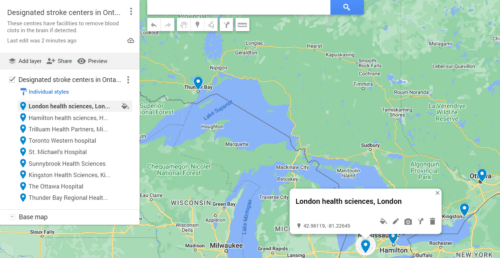
- I edited the layer and imported my data sheet to create the map.
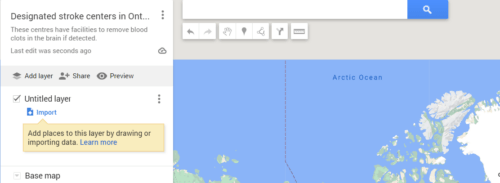
Then the result was this.
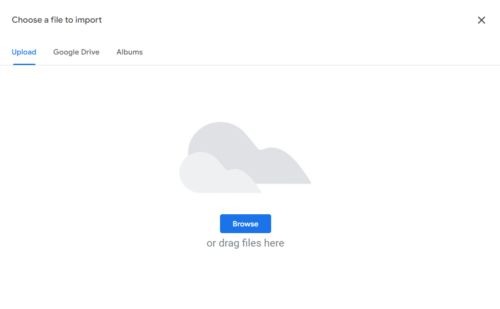
Then I clicked the import button.
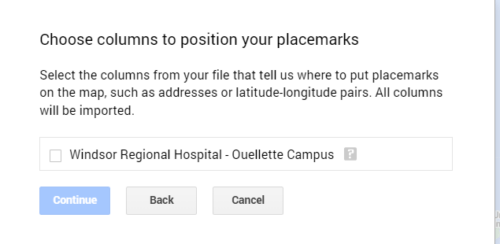
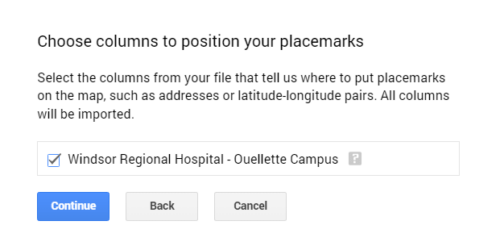
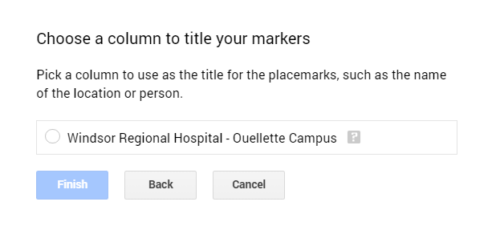
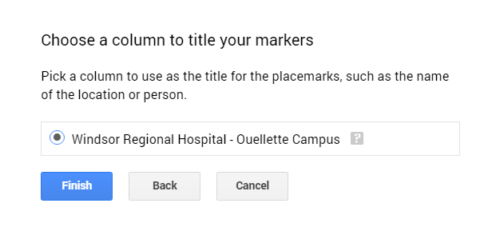
Then choose the columns.
Here is the link: https://www.google.com/maps/d/u/0/edit?hl=en&mid=1ZuA-ohAbmyOyibAYw2GkBdk4Wae3-_4&ll=45.506071770070406%2C-82.45972999999998&z=6
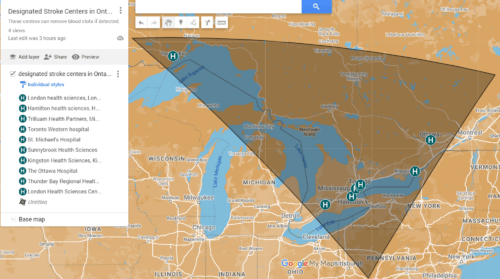
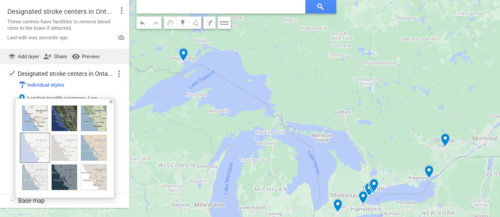
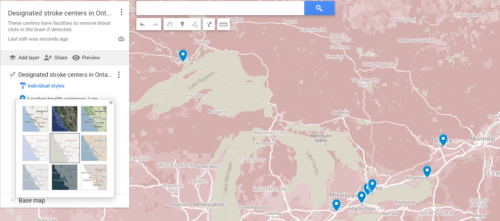
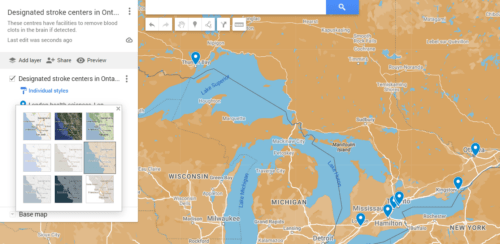
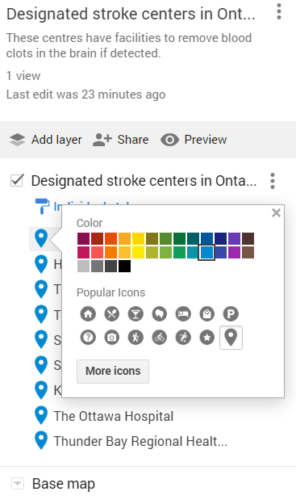
- I edited the base map with several styles as follows.
Base map changes
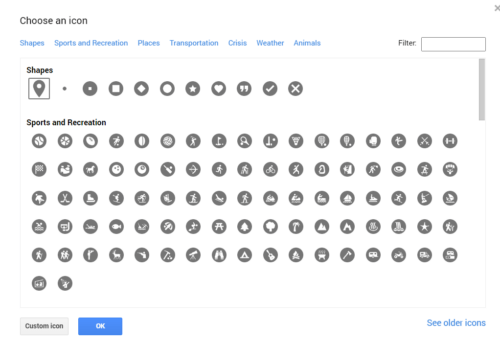
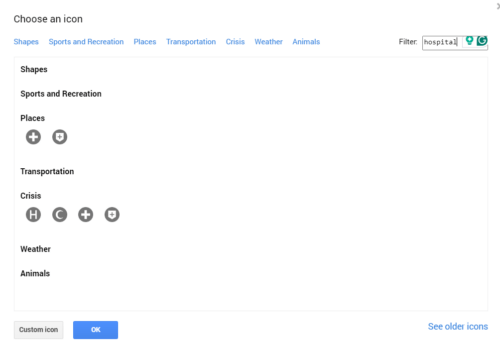
- Then, I changed the icons to identify hospitals.
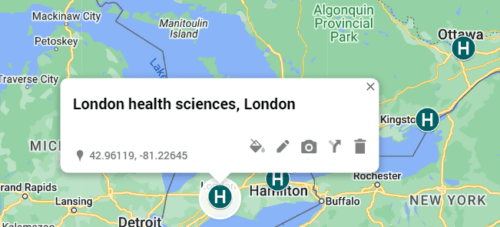
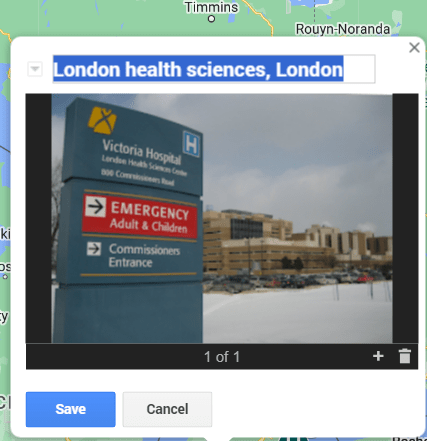
I clicked the London Health Sciences and found the following.
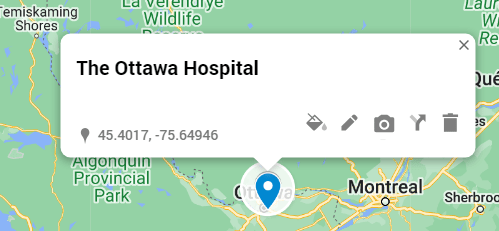
Changing the incon
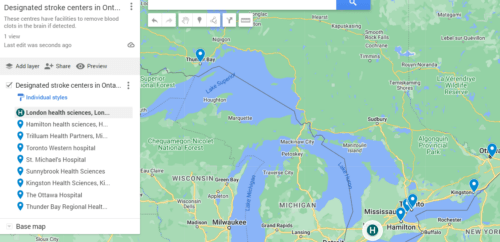
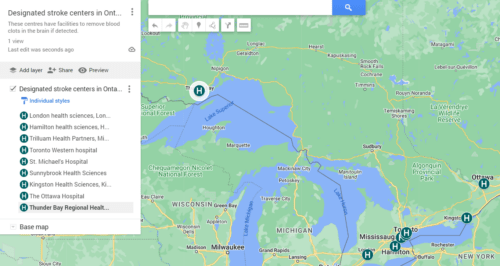
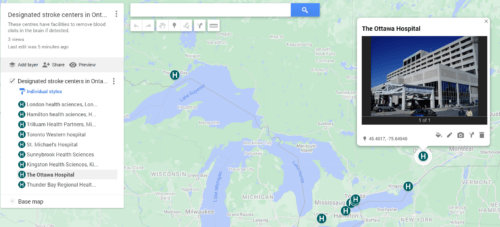
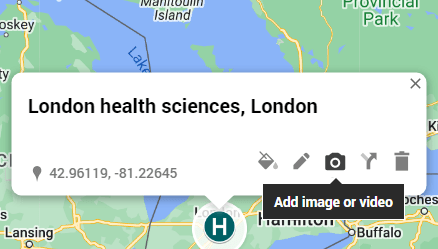
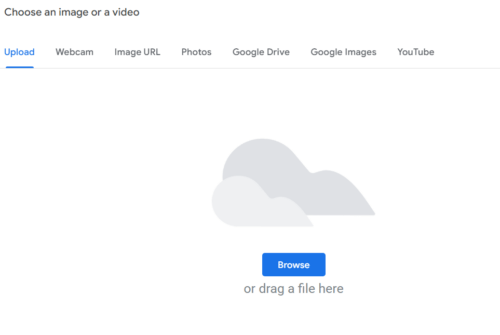
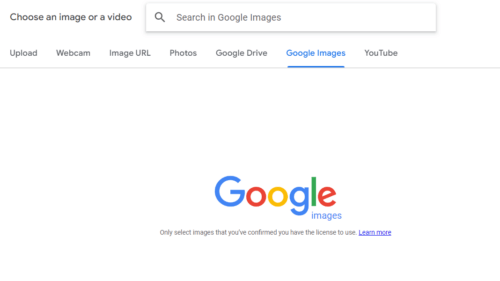
- I added hospital images to the relevant icons.
Adding images
This is the final map with its link: